|
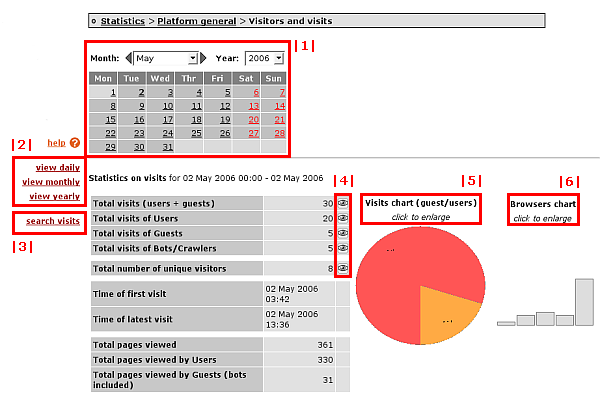
You see a calendar and an overview of all visits to your platform. On the right side there are two additional graphics.

The following options are available:
|1| Calendar:
Choose a day, month or year.
|2| view daily / monthly / yearly:
Here you can limit or extend the options provided in the calendar. For instance, if you click on "view yearly", only the drop-down menu "year" will be displayed in the calender.
|3| search visits:
"Search visits" offers filtering options for a certain time interval.
|4| Visit view:
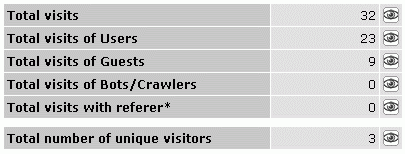
Click on an eye-button in the table. The "Visit view" opens where you can see all individual visits of the chosen time period.

You can limit the list of visits to certain user groups by using the drop-down menu at the top.

Click on the eye button in the column "Info". There you can find all information about a session. A session is the term used to describe all activities during one visit.
Some rows have a "referer"-button. This means that the respective visitor got to your platform via a link on another website. If you click on the button, the website which directed the visitor to your platform opens in a new window.

|5| Visits chart:
The first graph on the right side shows you the ratio of users and guests. In order to enlarge the graph, you need to click on it.
|6| Browser chart:
The browser chart shows you which browsers your visitors used. In order to view all data, click on the graph.
|

